Importing and Customizing Pre-Made Dashboards
In this lesson, we will import and customize the pre made dashboards.
Importing a dashboard#
Data sources are useless by themselves. We need to visualize them somehow. We could do that by creating our own dashboard, but that might not be the best (and easiest) introduction to Grafana. Instead, we’ll import one of the existing community-maintained dashboards. We just need to choose one that suits our needs.
open "https://grafana.com/dashboards"
Feel free to spend a bit of time exploring the available dashboards.
I think that Kubernetes cluster monitoring dashboard is a good starting point. Let’s import it.
Kubernetes cluster monitoring dashboard#
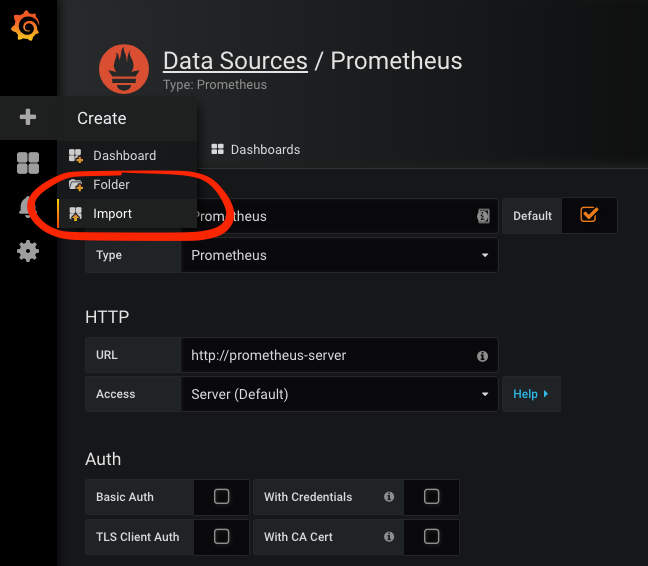
Please go back to Grafana UI, click the + icon from the left-hand menu, followed with the Import link, and you’ll be presented with a screen that allows us to import one of the Grafana.com dashboards, or to paste JSON that defines it. We’ll go with the former option.

Please type 3119 into the Grafana.com Dashboard field, and click the Load button. You’ll be presented with a few fields. The only important one, in this case, is the prometheus drop-down list. We must use it to set the data source. The choice is easy since we defined only one. Select Prometheus, and click the Import button.
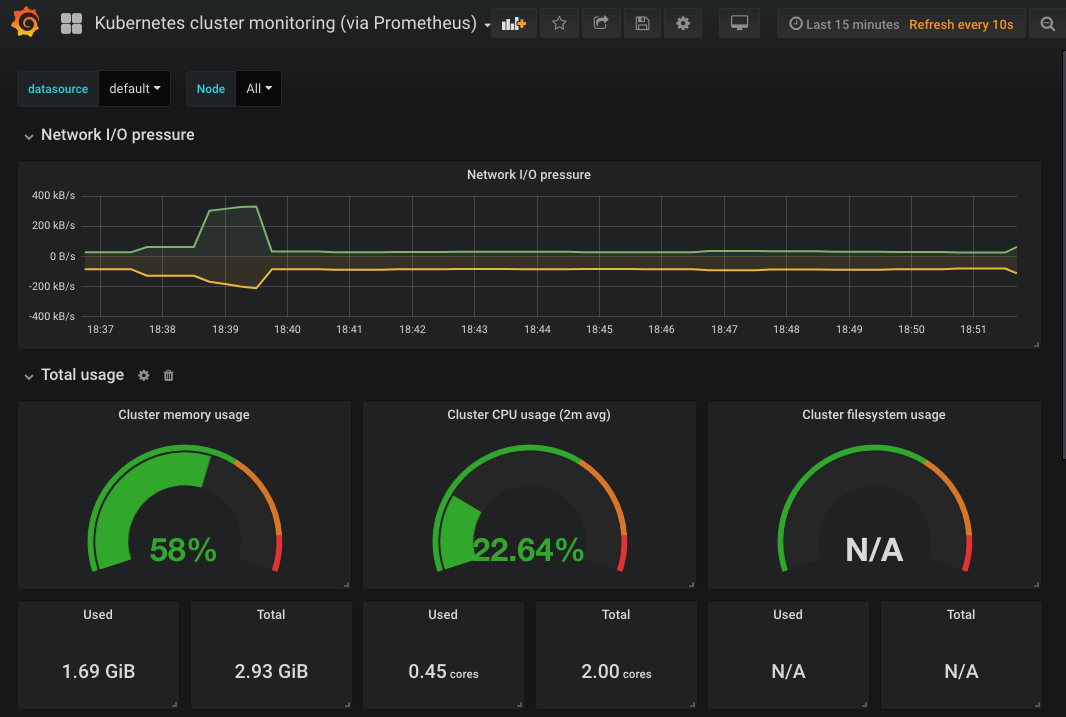
What you see in front of you is a dashboard with some of the essential Kubernetes metrics.

Importing a dashboard that acts as a base#
However, some of the graphs might not work. Does that mean that we imported a wrong dashboard? A simple answer is quite the opposite. Of all the available dashboards, this one probably has the most graphs working. At least, if we count only those that are, more or less, useful. Such an outcome is common. Those dashboards are maintained by the community, but most of them are made for personal use. They are configured to work in specific clusters and to use particular metrics. You won’t be able to find many dashboards that work without any changes and simultaneously show the things you truly need. Instead, I consider those dashboards a good starting point. I import them only to get a base that I can modify to serve my specific needs. That’s what we’re going to do next, at least partially.
For now, we’ll focus only on the changes aimed at making it fully operational. We’ll make some of the graphs that are currently without data operational, and we’ll remove those that are of no use to us.
If we take a closer look at the Total usage row, we’ll see that Cluster filesystem usage is N/A. There’s probably something wrong with the metrics it’s using. Let’s take a closer look.
🔍 In some clusters (e.g., EKS) the hard-coded file system in this dashboard is the correct one. If that’s the case (if Cluster filesystem usage is not N/A) you do not have to make any changes. However, I suggest you still go through the exercise while imagining that your cluster uses a different file system. That way you’ll learn a few tips that you could apply to other dashboards.
Please press the arrow next to the Cluster filesystem usage title, and click the Edit link.

The query used by that graph (formatted for readability) is as follows.
sum (
    container_fs_usage_bytes{
        device=~"^/dev/xvda.$",
        id="/",
        kubernetes_io_hostname=~"^$Node$"
    }
) /
sum (
    container_fs_limit_bytes{
        device=~"^/dev/xvda.$",
        id="/",
        kubernetes_io_hostname=~"^$Node$"
    }
) * 100
Exploring Grafana variables#
We won’t go into the details of that query. You should be familiar with Prometheus’ expressions by now. Instead, we’ll focus on the likely cause of the issue. We probably do not have a filesystem device called /dev/xvda (unless you’re using EKS or, in some cases, GKE). If that’s the problem, we can fix the Graph by simply changing the value to whatever our device is. But, before we go down that road, we might explore Grafana variables. After all, changing one hard-coded value with another will do us no good if we do not even know what our device is.
We could go to Prometheus and retrieve the list of all the devices, or we can let Grafana do that for us. We’ll choose the latter.
Take a closer look at the kubernetes_io_hostname. It’s set to ^$Node$. That is an example of using Grafana variables. We’ll explore them next, in an attempt to replace the hard-coded device.
Please click the Back to dashboard button located in the top-left corner of the screen.
Dashboard-wise configurations#
Click the Settings icon located at the top of the screen. You’ll be presented with all the dashboard-wide configurations we can change. Feel free to explore the options in the left-hand menu.
Since we are interested in creating a new variable that will dynamically populate the device label of the query, our next action is to click the Variables link in the Settings section, followed by the New button.
Please type device as the variable Name and IO Device as the Label. We will retrieve the values from Prometheus (the data source), so we’ll leave the Type to Query.
Next, we need to specify the Data source. Select $datasource. That tells Grafana that we want to query data from whichever data source we selected when we imported the dashboard.
Write Grafana queries#
So far, everything was probably self-explanatory. What comes next isn’t. We need to consult the documentation and learn how to write Grafana queries used as variable values.
open "http://docs.grafana.org/features/datasources/prometheus/#query-variable"
Let this be an exercise. Find out, through the documentation, how to write a query that retrieves all distinct values of the label device available in the container_fs_usage_bytes metric.
Grafana supports only four types of variable queries so I suppose you did not have a hard time finding out that the expression we should add to the Query field is label_values(container_fs_usage_bytes, device).
With the query in place, all that’s left is to click the Add button.

kubernetes_io_hostname is set to ^$Node$. This is an example of using Grafana variables.
A)
True
B)
False
Now we should go back to dashboard and confirm that the new variable is available.
You should see a new drop-down list with the label IO Device at the top-left section of the screen. If you expand it, you’ll see all the devices used in our cluster. Make sure that the correct device is selected. That is likely /dev/sda1 or /dev/xvda1.
Next, we need to change the graph to use the variable we just created.
Please click the arrow next to the Cluster filesystem usage graph, and select edit. The metric (query) contains two hard-coded ^/dev/xvda.$ values. Change them to $device, and click the Back to dashboard button located in the top-left corner of the screen.
That’s it. The graph now works correctly by showing us the percentage of cluster file system usage (/dev/sda1).
However, the Used and Total numbers below it are still N/A. I believe you know what to do to fix them. Edit those graphs and replace ^/dev/xvda.$ with $device.
Remove useless graphs#
There are still two issues to solve with that dashboard. Or, to be more precise, two graphs are useless to us. The purpose of the System services CPU usage and System services memory usage graphs should be deducible from their titles. Yet, most Kubernetes clusters do not provide access to system-level services (e.g., GKE). Even if they do, our Prometheus is not configured to fetch the data. If you don’t believe me, copy the query of one of those graphs and execute it in Prometheus. As it is now, those graphs are only wasting space, so we’ll remove them.
Please click the trash icon next to the title of the System services CPU usage row. Click Yes to remove both the row and the panel. Repeat the same actions for the System services memory usage row.
Save dashboard#
Now we’re done with making changes to the dashboard. It is fully operational, and we should persist the changes by clicking the Save dashboard icon in the top-right corner of the screen, or by pressing CTRL+S.
We won’t go into all the Grafana options and the actions we can do. I’m sure that you can figure them out yourself. It is a very intuitive application. Instead, we’ll try to create our own dashboard. Or, at least, explore a few things that will allow you to continue on your own.
In the next lesson, we will create our very own custom dashboard.
